Bollinger bands are used by investors for analysis. In the world of crypto, these bands are really useful. Bollinger bands detect changes in the price of coins and go a long way in helping people make sound decisions with regards to crypto investment. Candlestick charts are informational charts and are also great for determining the price movements of the crypto market, forex market and other trading markets. This also helps create a buy/sell plan. The Candlestick charts were invented by Japanese analysts and are very important for showcasing the opening, highest and lowest prices of prices over a certain period of time. Let’s find out more about both.
Bollinger Bands And Candlestick Charts: All You Need To Know
Bollinger Bands
What are Bollinger Bands?
Bollinger bands were discovered in the 1980s by an economics analyst named John Bollinger. It is an indicator frequently used by traders as it provides information about the price activity that will occur in the market, and provides a quicker and easier way to predict the price decreases and increases that are expected to occur in the future.
Bollinger, which is used in all investment markets, maintains its importance in the crypto money market, which has started to be preferred more recently. In volatile markets, Bollinger helps to keep track of trends in prices.
Bollinger bands are indicators that take into account the movement in the prices in the investment market and the separation of prices from the averages (you can use Bollinger bands to analyze the trades you make via news spy). With Bollinger bands, it is possible to get a relative idea that the prices will go up or down, but like every indicator, this indicator cannot direct the market alone and the results cannot be seen with certainty.
How to use Bollinger Bands?
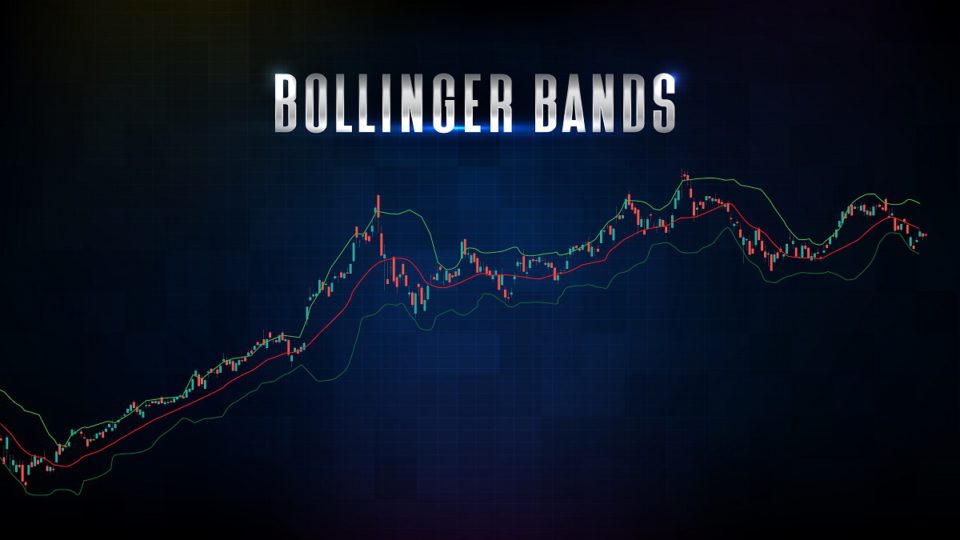
Bollinger bands consist of three lines, the middle Bollinger line, the lower Bollinger line, and the upper Bollinger line. The line showing the average of prices and another line that touches the edges of the lines formed can also be seen. The middle Bollinger line is the simple moving average that usually takes into account a 20-day period. The Simple Moving Average serves as a foundation for the upper and lower bands, used as a way of measuring mobility by observing the relationship between prices and bands. The generally accepted formula is as follows;
- Middle Bollinger Line: Average 20-Day Movement
- Lower Bollinger Line: Middle Bollinger Line – 2 Standard Deviation
- Upper Bollinger Line: Middle Bollinger Line + 2 Standard Deviation
The intersection of Bollinger bands, which gives you information about the trend direction of prices, shows that a corrective movement will occur in the opposite direction of the trend. However, if the price fluctuations occur within the lines in the Bollinger band, it is not possible to have a prediction about the future values of the prices. The compression of Bollinger bands is interpreted as stagnation in the values in the financial market, while the intersection of the bands signals that there will be improvements in prices.
In investment markets, a prediction can be made by looking at the support lines if the prices are decreasing, and by looking at the resistance lines if the prices are increasing.
Investors, who make their investment decisions in the financial market by looking at the Bollinger bands, can only make their decisions when the price values of the lower Bollinger line and the upper Bollinger line are exceeded. So, we can explain this situation like this, let’s say you think the price will go up; In this case, before investing, the price increase must first rise above the Bollinger line. If the price values stay between the Bollinger lines and do not show a real rise as you predicted, it will not make much sense to invest.
You should not make an investment decision without taking action in line with your forecasts on the price movement, the chart. Because otherwise, if a movement occurs, you may lose money.
What are the advantages of Bollinger Bands?
Everyone who wants to invest wants to be able to predict what may happen in the future, price decreases or increases while investing. Bollinger bands not only give you insight into prices but also give you an idea of the investment. In addition, this indicator has many more advantages.
- Shows high and low levels
- It allows the direction of the trend to be seen.
- It enables the determination of new trend beginnings.
- It takes on the task of helping you set targets about prices.
- It gives information about the squeezes in prices.
- It gives clues about the volatility of the movement in prices.
Tips on analysis with Bollinger bands
Bollinger bands are one of the indicators frequently used by users who have just started technical analysis because they can be solved quite easily. However, the effect of the analysis can be quite low due to the fact that investors overlook some details while analyzing. With the tips we will give you, you can make healthier analyzes and make more accurate investment decisions.
- Use Bollinger bands in markets with high volatility. Because Bollinger bands give more effective results in markets with high volatility.
- If the prices exceed the Bollinger band, it is necessary to start the buying process by anticipating that the prices will rise further. In cases where the lower Bollinger band is broken, a “sell” order is expected. However, since this situation is not possible to give definite results in practice, the analysis made with volume indicators or oscillators must be confirmed.
- When the Bollinger band widens and prices rise considerably, the idea that new price trends will start arises. However, in such cases, it would not be right to make an investment decision directly. First of all, different indicators should also be taken into account.
Candlestick Charts
Candlestick charts, which can be used in different ways such as 15 minutes, 1 hour, 4 hours, daily, weekly, monthly, are tools that guide the investor while doing technical analysis. There are also thin candles called “needles” or “pins” in this information source, which is called a “candlestick chart” because it is in the form of candles.
What is a Candlestick Chart?
Candlestick chart, which is one of the analysis methods that technical analysts frequently use when buying and selling, is a kind of analysis method that displays data about prices on graphs and allows investors to analyze within a macro scale by combining graphic parts.
Unlike other charts, the candlestick chart differs from other charts used in technical analysis as it contains so much data that it can be analyzed. Candlestick charts not only show the price activity within a certain period of time, but also allow the prediction of price values that may occur in the future.
Looking at the candlestick chart, you can see the opening price in the time frame below the thick part of the chart and the closing price at the top. In addition, the upper part of the vertical lines seen with the thick part of the chart shows the highest price, and the lower part shows the lowest price ratios that occurred in the current time frame.
How to read Candlestick charts?
It is possible to see the 4 most basic information needed to benefit from different analysis techniques with the candlestick chart, because when we look at the candlestick chart, the closing, opening, highest and lowest prices within the current time frame can be analyzed. The data in the candlestick chart can be easily used in different analysis methods, but it is almost impossible to predict what changes will happen in prices by looking at just one candle.
Looking at the candlestick chart, the fluctuations caused by the downward movements of the prices and the upward movements of the prices allow the candles on the chart to appear in different ways in a short period of time. Price rises in the crypto money markets are shown in green, and decreases in red. It is very important to know what information these colors in the candlestick chart give to the investors.
The meaning of the colors may differ depending on which application it is viewed from. However, mostly green candlesticks show the price increases, and black or red candlesticks represent downward movements in prices.
Candlestick charts provide very effective data for investors who want to see the movement in prices after the transactions made within a certain time period with a single glance and make a quick investment decision.
When traders look at the chart, they should understand that prices are rising if the price at the time of the opening is above the closing price. Even if the closing price is below the opening price, the traders who trade that the prices have decreased should understand.
If there are no significant changes in prices when looking at the candlestick chart, if the prices are within the relevant time frame and if the prices are generally at the same levels, the resulting candlestick chart is called “doji”. If there is a plus sign in the candlestick chart, it means that it is a “doji star”.
The doji star in the form of a plus (+) sign in the candlestick chart means that the values and fluctuations of prices in the cryptocurrency market are very low. In markets where the Doji star is seen, the price changes are so low that it becomes almost impossible to even form the body of the candle on the chart.
It is not possible to put the candlestick chart into a certain pattern, as it is one of the effective charts that shows the basic information that will be needed in every formation that may occur, and that has different forms all the time. Because there are many formations in the candlestick chart.
What are candlestick patterns?
It is called creating a meaningful and valuable whole with the collection of images that are formed without a specific meaning.
- Articulated bull formation,
- hammer bull formation,
- pregnant bull formation,
- engulfing bull formation,
- cross country pregnant bull formation,
- Piercing candles bullish formation,
- Inverted hammer bullish pattern
- Doji star bull formation,
- pigeon nest bull formation,
- The touching candles are bullish,
- Top candles bullish pattern,
- white soldier bull formation,
- Doji morningstar bull formation,
- Morningstar bull formation,
- three star bull formation,
- abandoned baby bull formation,
- triple valley bull formation,
- Three white soldier bull formation,
- Two bull bull formation breaking down,
- Falling block bullish pattern.